
When the API changes under you
Your app’s models expect one shape of JSON, and one day the server sends another. A number that was
always a double arrives as an int. An id that was an int becomes a string. A key goes missing,
comes back null, or is renamed. A list turns into an object. fromJson throws, the screen shows an
error or nothing at all, and the usual hour goes on working out which call returned the body and
which field in it changed.
CodeScout’s network capture records the response body of each call. This page shows how to tie the error your model throws to the call that produced the body, so that you read the two together: the exception, and under it the JSON that caused it.
Take a cart model like this one:
class Cart {  Cart({required this.items, required this.subtotal});
  final int items;  final double subtotal;
  factory Cart.fromJson(Map<String, dynamic> json) => Cart(        items: json['items'] as int,        subtotal: json['subtotal'] as double,      );}
The server used to send "subtotal": 49.0 and now sends "subtotal": 49. Dart reads the first as a
double and the second as an int, so json['subtotal'] as double throws
type 'int' is not a subtype of type 'double' in type cast. That message names two types. It does
not name the call, the endpoint or the field.
Before you start
Section titled “Before you start”Keep the network logs. CodeScout writes a call’s request and response at debug.
minimumLevel defaults to info, and the level check runs before anything else, so at the default
a call that answered 200 is not kept anywhere, not even in the in-app panel. Your error would then
point at a call nobody recorded. Set the level to debug while you investigate:
CodeScoutConfiguration( logging: LoggingBehavior(minimumLevel: LogLevel.debug),)A call that fails is different: its failure is logged at error, which the default keeps. Dio
counts a 4xx or 5xx as a failure, and package:http treats it as an ordinary response. If you have
narrowed enabledTags, keep network in the set, because every network log carries that tag and
no other. In production, the way to keep calls without keeping every log from every user is to stay
at debug and lower sessionSampleRate, as Controlling volume describes.
Install an interceptor. Calls are captured by code_scout_dio or code_scout_http.
Network inspection covers both.
Use versions that have the link. The requestId parameter is new in code_scout 1.6.0, and
the codeScoutRequestId getter that gives you the id is new in code_scout_dio 1.1.0 and
code_scout_http 1.1.0:
dependencies: code_scout: ^1.6.0 code_scout_dio: ^1.1.0 # or code_scout_http: ^1.1.0On the server, the section that shows your log beside its call is new in the 1.2.0 dashboard. An
older dashboard stores the log and finds it with request:, but does not show it with the call.
Log the failure with the call’s id
Section titled “Log the failure with the call’s id”Catch the failure where you call fromJson, and log it with requestId set to the call’s id. The
companion package puts that id on the response as codeScoutRequestId. Keep whatever your code
already does after a failure, whether that is rethrowing or showing an error state. The log is the
only addition.
The id is the one CodeScout gives each call it captures, a UUID. It is not a header your server
sends, such as X-Request-Id.
import 'package:code_scout/code_scout.dart';import 'package:code_scout_dio/code_scout_dio.dart';import 'package:dio/dio.dart';
Future<Cart> loadCart(Dio dio) async {  final response = await dio.get<Map<String, dynamic>>('/v2/cart');  try {    return Cart.fromJson(response.data!);  } catch (e, st) {    CodeScout.instance.e(      'Could not read GET /v2/cart',      error: e,      stackTrace: st,      requestId: response.codeScoutRequestId,    );    rethrow;  }}
The log is now linked to the call that returned the body. It stays an ordinary error log, not a network log, so it never changes the call: a call that answered 200 is still a complete 200, with the same status and duration, and it is not counted as failed.
A body that is not the type you asked for
Section titled “A body that is not the type you asked for”When you ask Dio for a type, as dio.get<List<dynamic>> does below, Dio casts the body to that
type after the interceptors have run. If the endpoint starts returning an object instead of a list,
the cast fails inside Dio, and instead of a response you get a DioException with the TypeError
inside it. CodeScout has already recorded the call as an answered 200, body included, and the
exception has the same getter:
Future<List<dynamic>> loadCartItems(Dio dio) async { try { final response = await dio.get<List<dynamic>>('/v2/cart/items'); return response.data!; } on DioException catch (e, st) { if (e.error is TypeError) { CodeScout.instance.e( 'Could not read GET /v2/cart/items', error: e.error, stackTrace: st, requestId: e.codeScoutRequestId, ); } rethrow; }}The log carries e.error, the TypeError, rather than the whole exception. The exception’s own
text is Dio’s header, DioException [unknown]: null, with the TypeError’s text under it. With
e.error, the error line beside the call names the two types that did not match, and nothing more.
You do not need a log of your own for most other failures. CodeScout records these as the call’s error: a 4xx or 5xx, a call with no answer at all, and a body Dio could not decode. The last is recorded with no status and no body.
A DioException that another interceptor raised with handler.reject is different. One example is
an interceptor that turns a 200 carrying {"success": false} into an error. CodeScout keeps what its
own interceptor saw before the rejection, which depends on where the other one sits in
dio.interceptors:
- If the response had reached CodeScout’s interceptor, the call is an answered 200.
- If only the request had, the call shows as pending.
- If the rejection came before CodeScout’s interceptor saw the request, nothing is recorded, and
e.codeScoutRequestIdis null.
If you want those beside the call, log them yourself with e.codeScoutRequestId.
package:http
Section titled “package:http”import 'dart:convert';
import 'package:code_scout/code_scout.dart';import 'package:code_scout_http/code_scout_http.dart';import 'package:http/http.dart' as http;
final client = CodeScoutHttpClient(client: http.Client());
Future<Cart> loadCart() async { final response = await client.get(Uri.parse('https://api.shop.dev/v2/cart')); try { return Cart.fromJson(jsonDecode(response.body) as Map<String, dynamic>); } catch (e, st) { CodeScout.instance.e( 'Could not read GET /v2/cart', error: e is FormatException ? 'FormatException: ${e.message}' : e, stackTrace: st, requestId: response.codeScoutRequestId, ); rethrow; }}jsonDecode and the cast to a map are inside the try, so a body that is not JSON at all, or a
list that became an object, is caught by the same catch. A FormatException from jsonDecode
quotes the part of the body where parsing stopped, and the error you log is not redacted, so the
example logs only its message. Limits says more. The getter returns null for a response
that did not come through a CodeScoutHttpClient, and a null requestId simply logs without a
link.
Four things that decide whether this works
Section titled “Four things that decide whether this works”Catch it yourself. CodeScout does not catch errors on its own. It installs no
FlutterError.onError handler and no zone, so a TypeError that nothing catches never reaches it.
If you forward uncaught errors to CodeScout yourself, as Errors and grouping
shows, they still arrive without the call’s id, because only the code holding the response has it.
Put the exception in error:. The section that lists your log beside the call shows its
message and its error, and not its metadata. A live session is narrower still: the phone sends your
log’s message and error and leaves its metadata behind. The live screen shows the message, and an
agent reading the session through tail_live_session sees the message and the error. An exception
kept only in metadata reaches none of them. Metadata is still the place for anything else, such as
the name of the field you were reading.
Name the endpoint in the message. The Errors screen groups an ordinary error by its message,
after blanking the parts that change from one occurrence to the next: numbers, quoted strings,
uuids, long hex strings, and any word that mixes letters and digits.
Could not read GET /v2/cart is grouped as Could not read GET /{id}/cart, so every failure to
read the cart is one row with a count, and a failure to read /v2/orders is a row of its own. The error text and the request id play no part
in the grouping, so a message that is the same for every endpoint, such as
Could not parse response, puts every endpoint into one row. The v2 is blanked as well, since it
mixes a letter and a digit, which means /v1/cart and /v2/cart share a row.
Pass the id the getter gives you. CodeScout keeps a request id only when it is a UUID in the
standard 8-4-4-4-12 form, and stores it in lowercase. Anything else is dropped from the log, because
the server stores request ids as UUIDs and a value that did not parse would fail the whole upload.
The log itself is kept, and the SDK says once per launch, in the debug console, that it dropped an
id. It never prints the value. Your backend’s own X-Request-Id is the wrong id even when it is a
UUID: it is kept, and it links your log to a call CodeScout never recorded.
Reading it
Section titled “Reading it”In the app
Section titled “In the app”Open the panel, go to the Network tab, tap the call and open its Response pane. The call’s row in the list does not change: it answered 200, so the row stays green with its 200. On the Response pane, a section headed Logged by the app lists what your app logged with the call’s id, above the headers and the body. Each entry shows the level, the time, the message and the error, and tapping it opens the log.
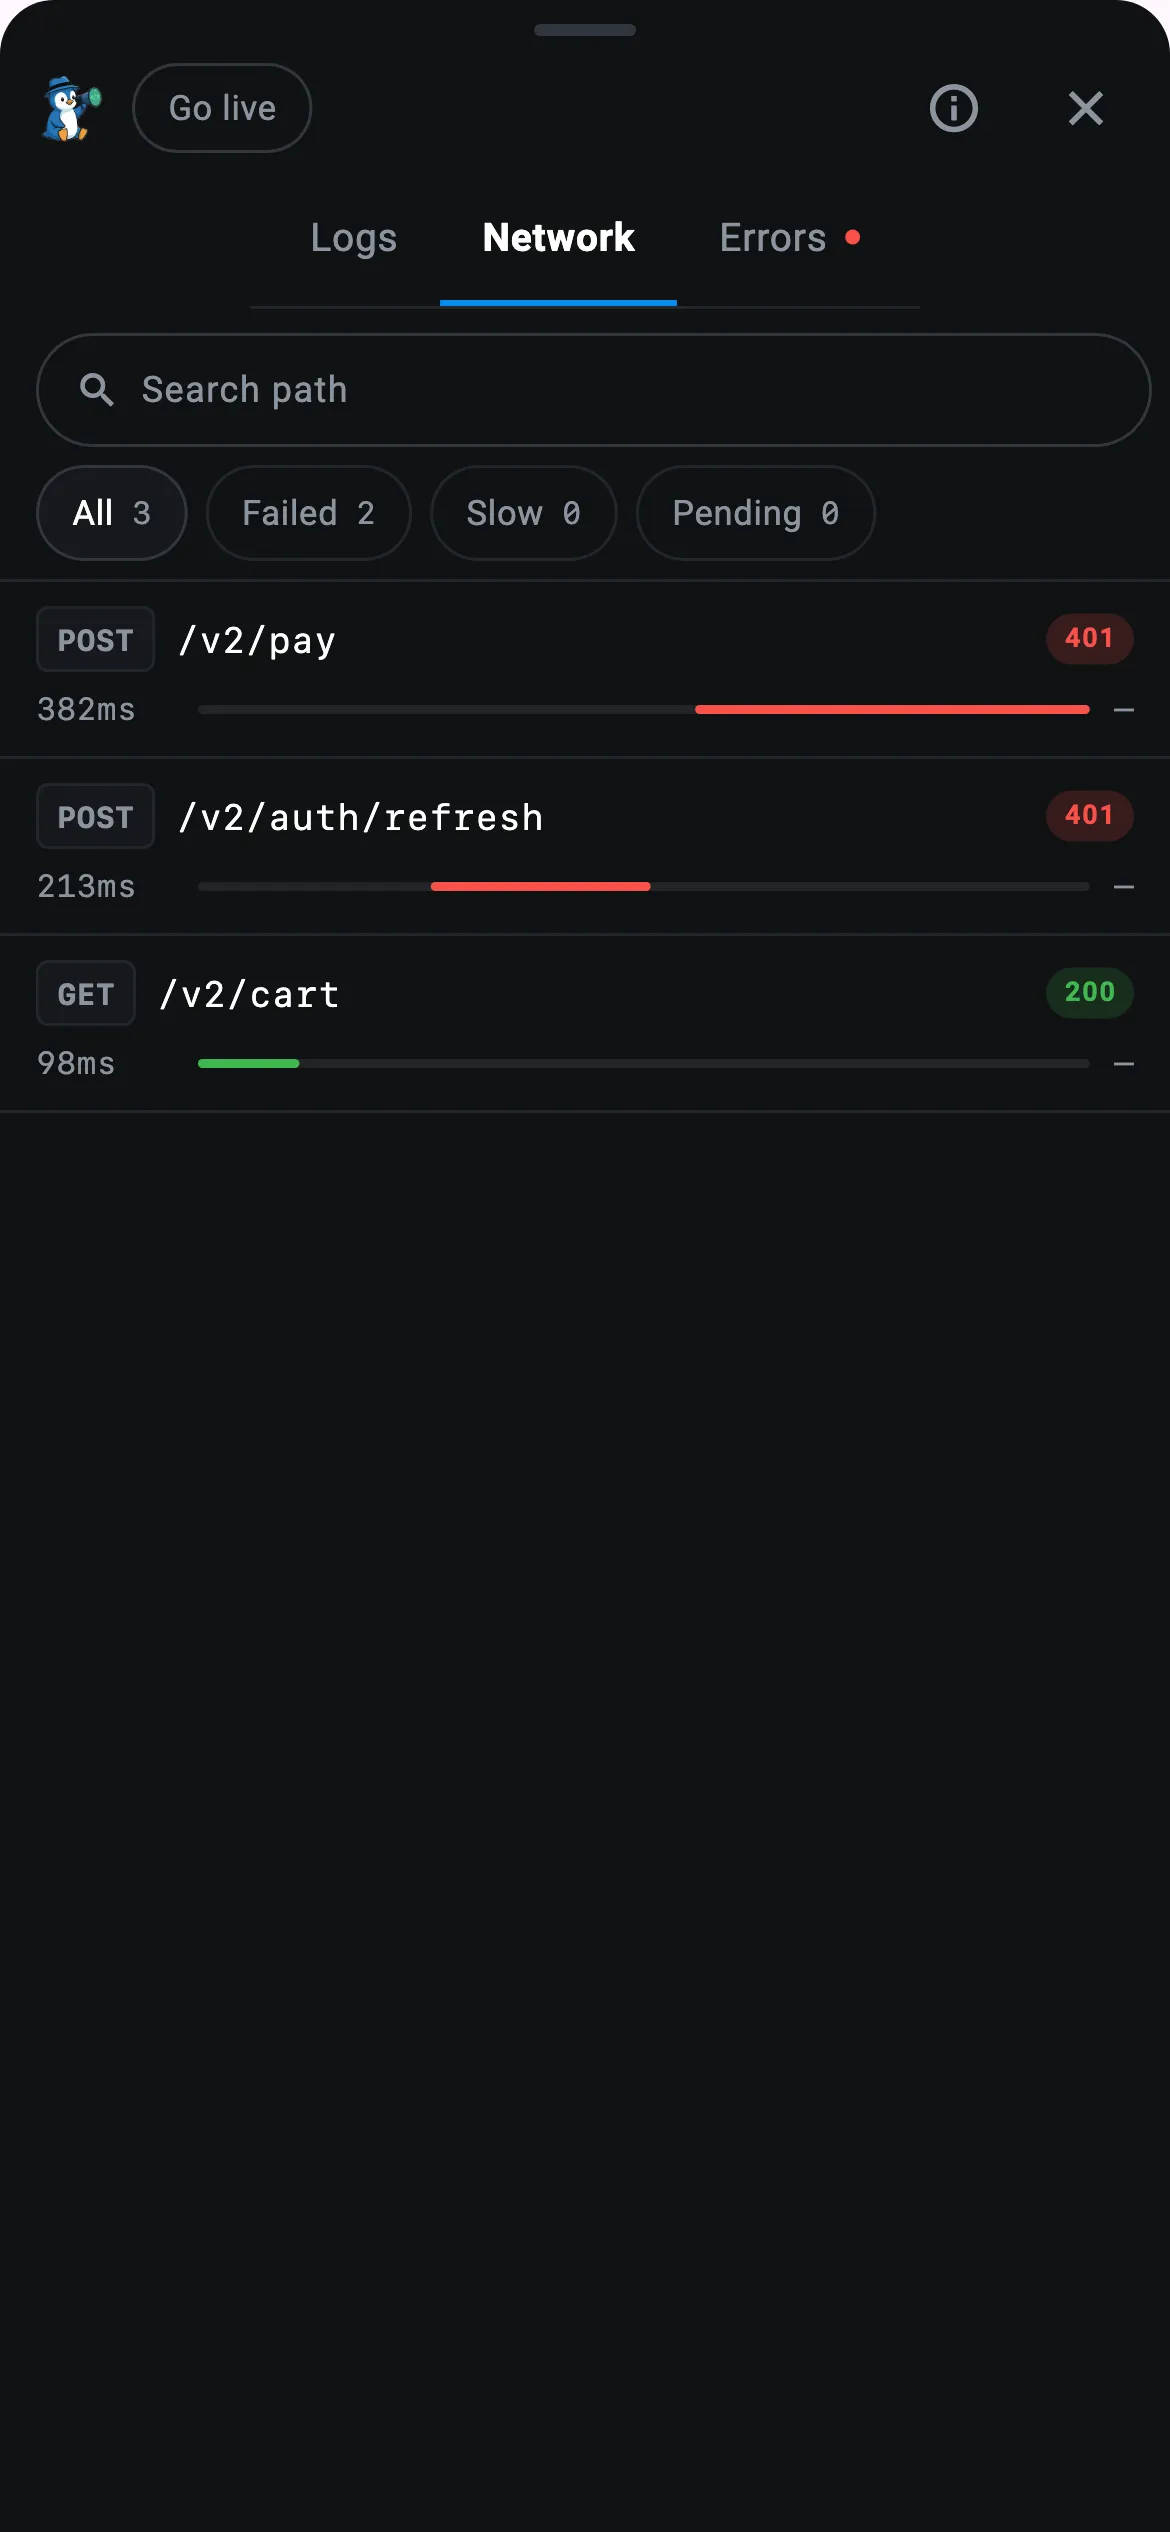 | 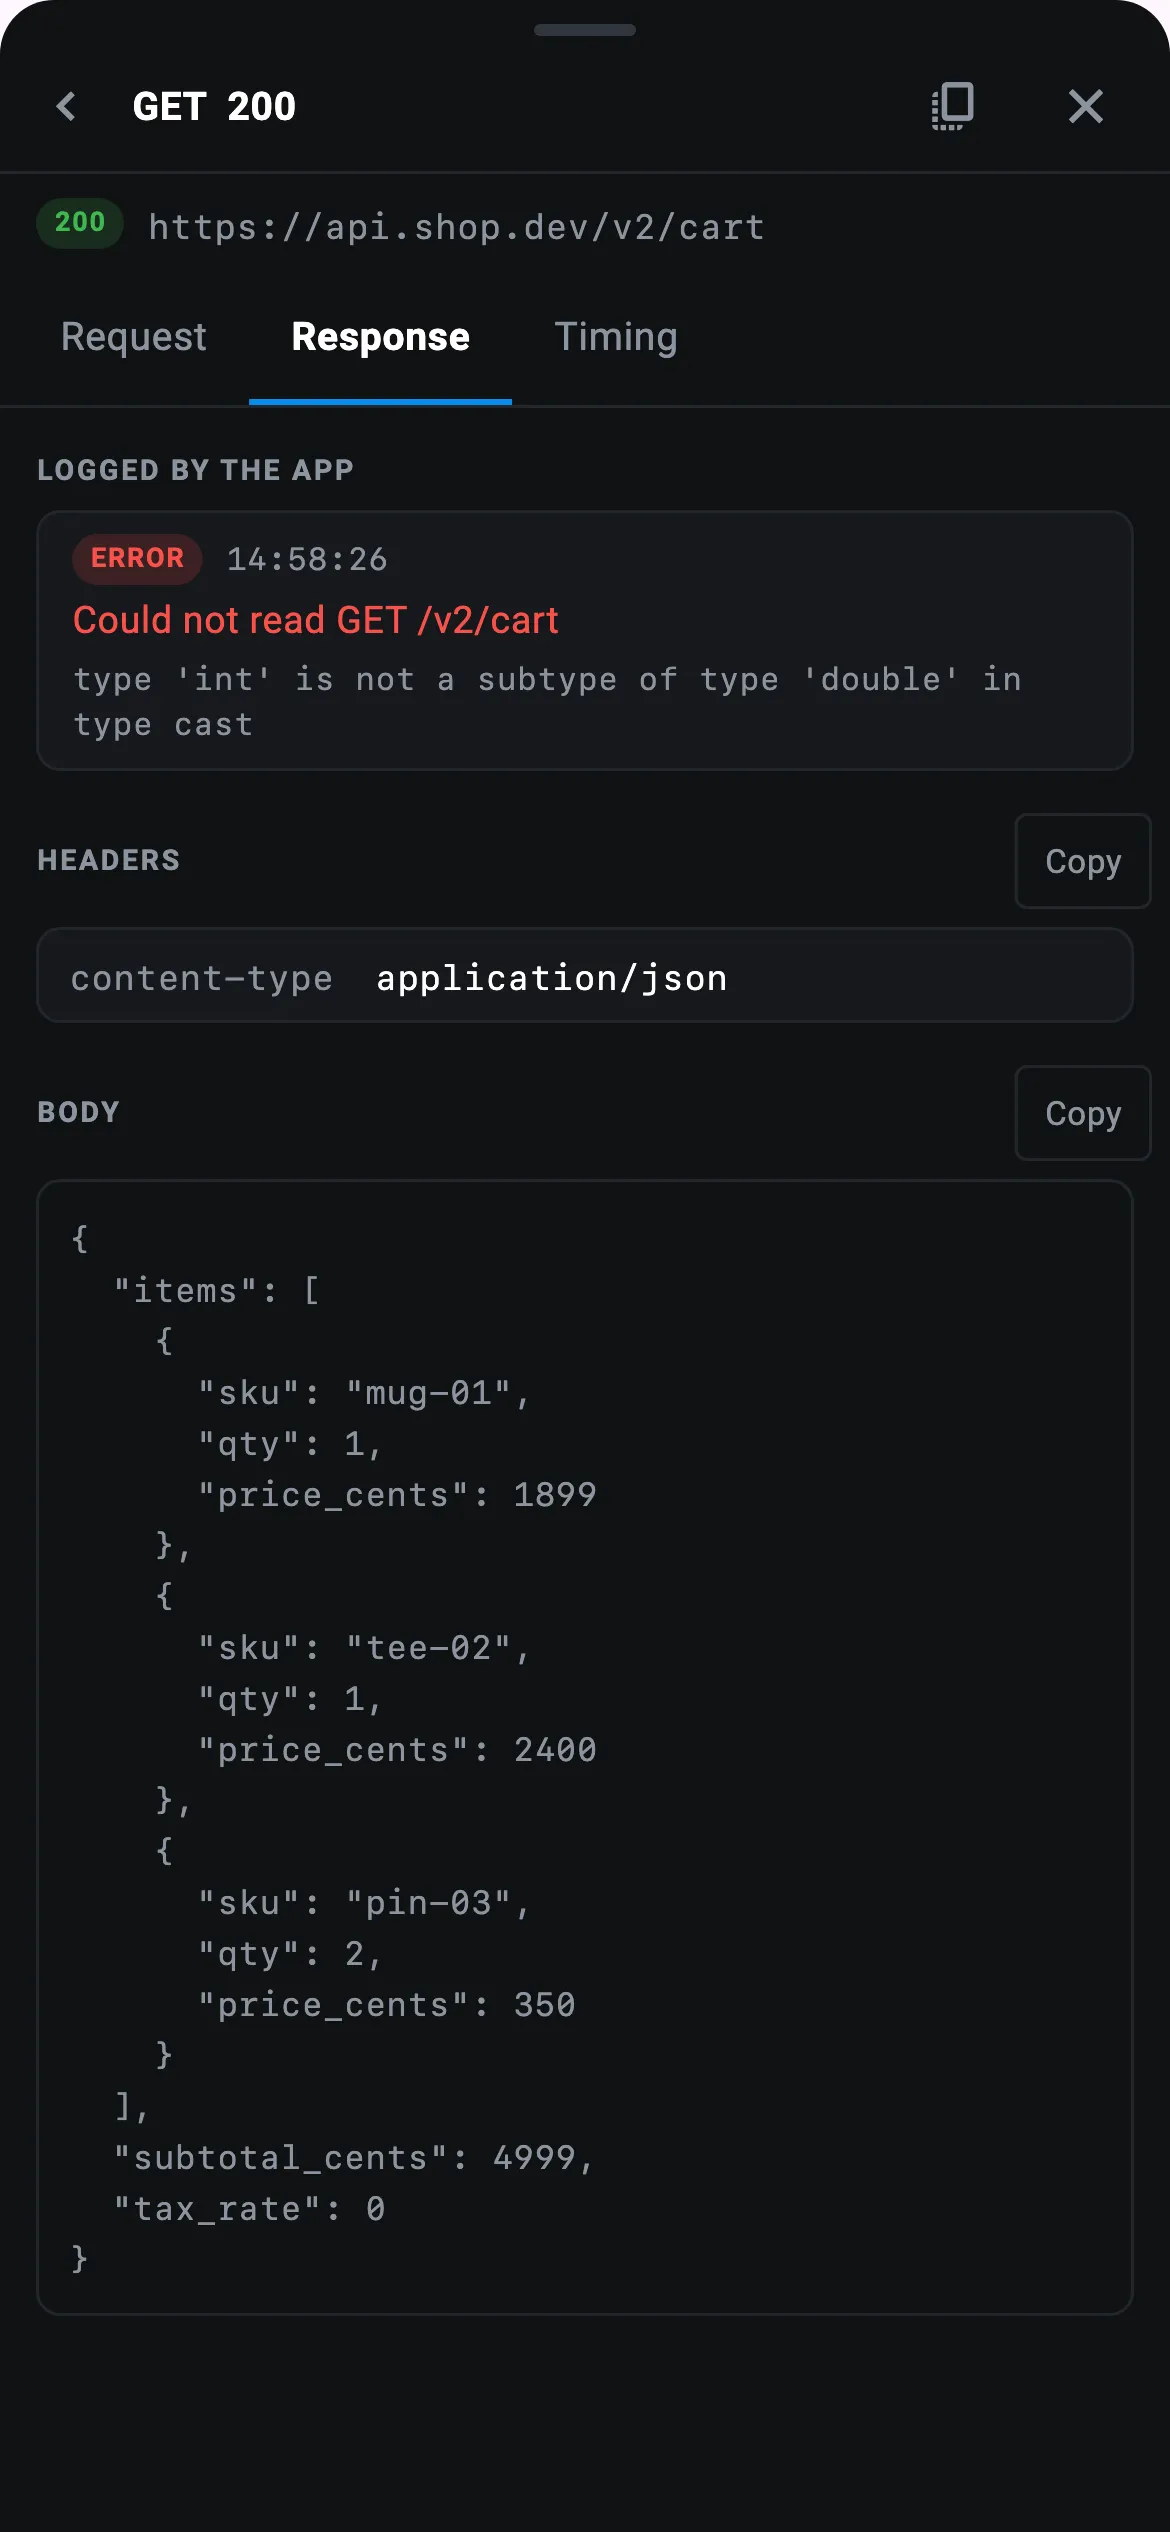 |
The Network tab. GET /v2/cart answered 200, and its row is green. | GET /v2/cart on its Response pane. The app’s error about the body sits above the headers and the body, in which tax_rate is 0. |
From the log’s side, a log your app wrote with a request id has a Call section with the call’s
method, path and status, and tapping it opens the call on its Response pane. When the call is not
in the panel, the section shows the full request id with a Copy button instead. At a minimumLevel of
info that is what you will see, because the call’s network logs were never kept. The panel also
holds only the newest 500 logs of the launch, so on a busy launch the call can scroll out before
you look.
A few smaller things help on the device. The Logs tab’s search finds a request id once you type or
paste its first eight characters or more, and lists the call’s network logs and your log together.
Copying a log adds a request <id> line with the id in full, so a bug report pasted from the phone
can be searched on the dashboard. Copying the call, with the button at the top of its page, includes
what your app logged about it. With printToConsole on, the console’s printout of your log
includes its request id.
On the dashboard
Section titled “On the dashboard”Open the Network screen and select the call. Between the call’s header and its tabs, a section headed Logged by the app lists your app’s logs about it, each with its time, level, message and error. It stays in place whichever tab you open, so the error sits directly above the response body that caused it.
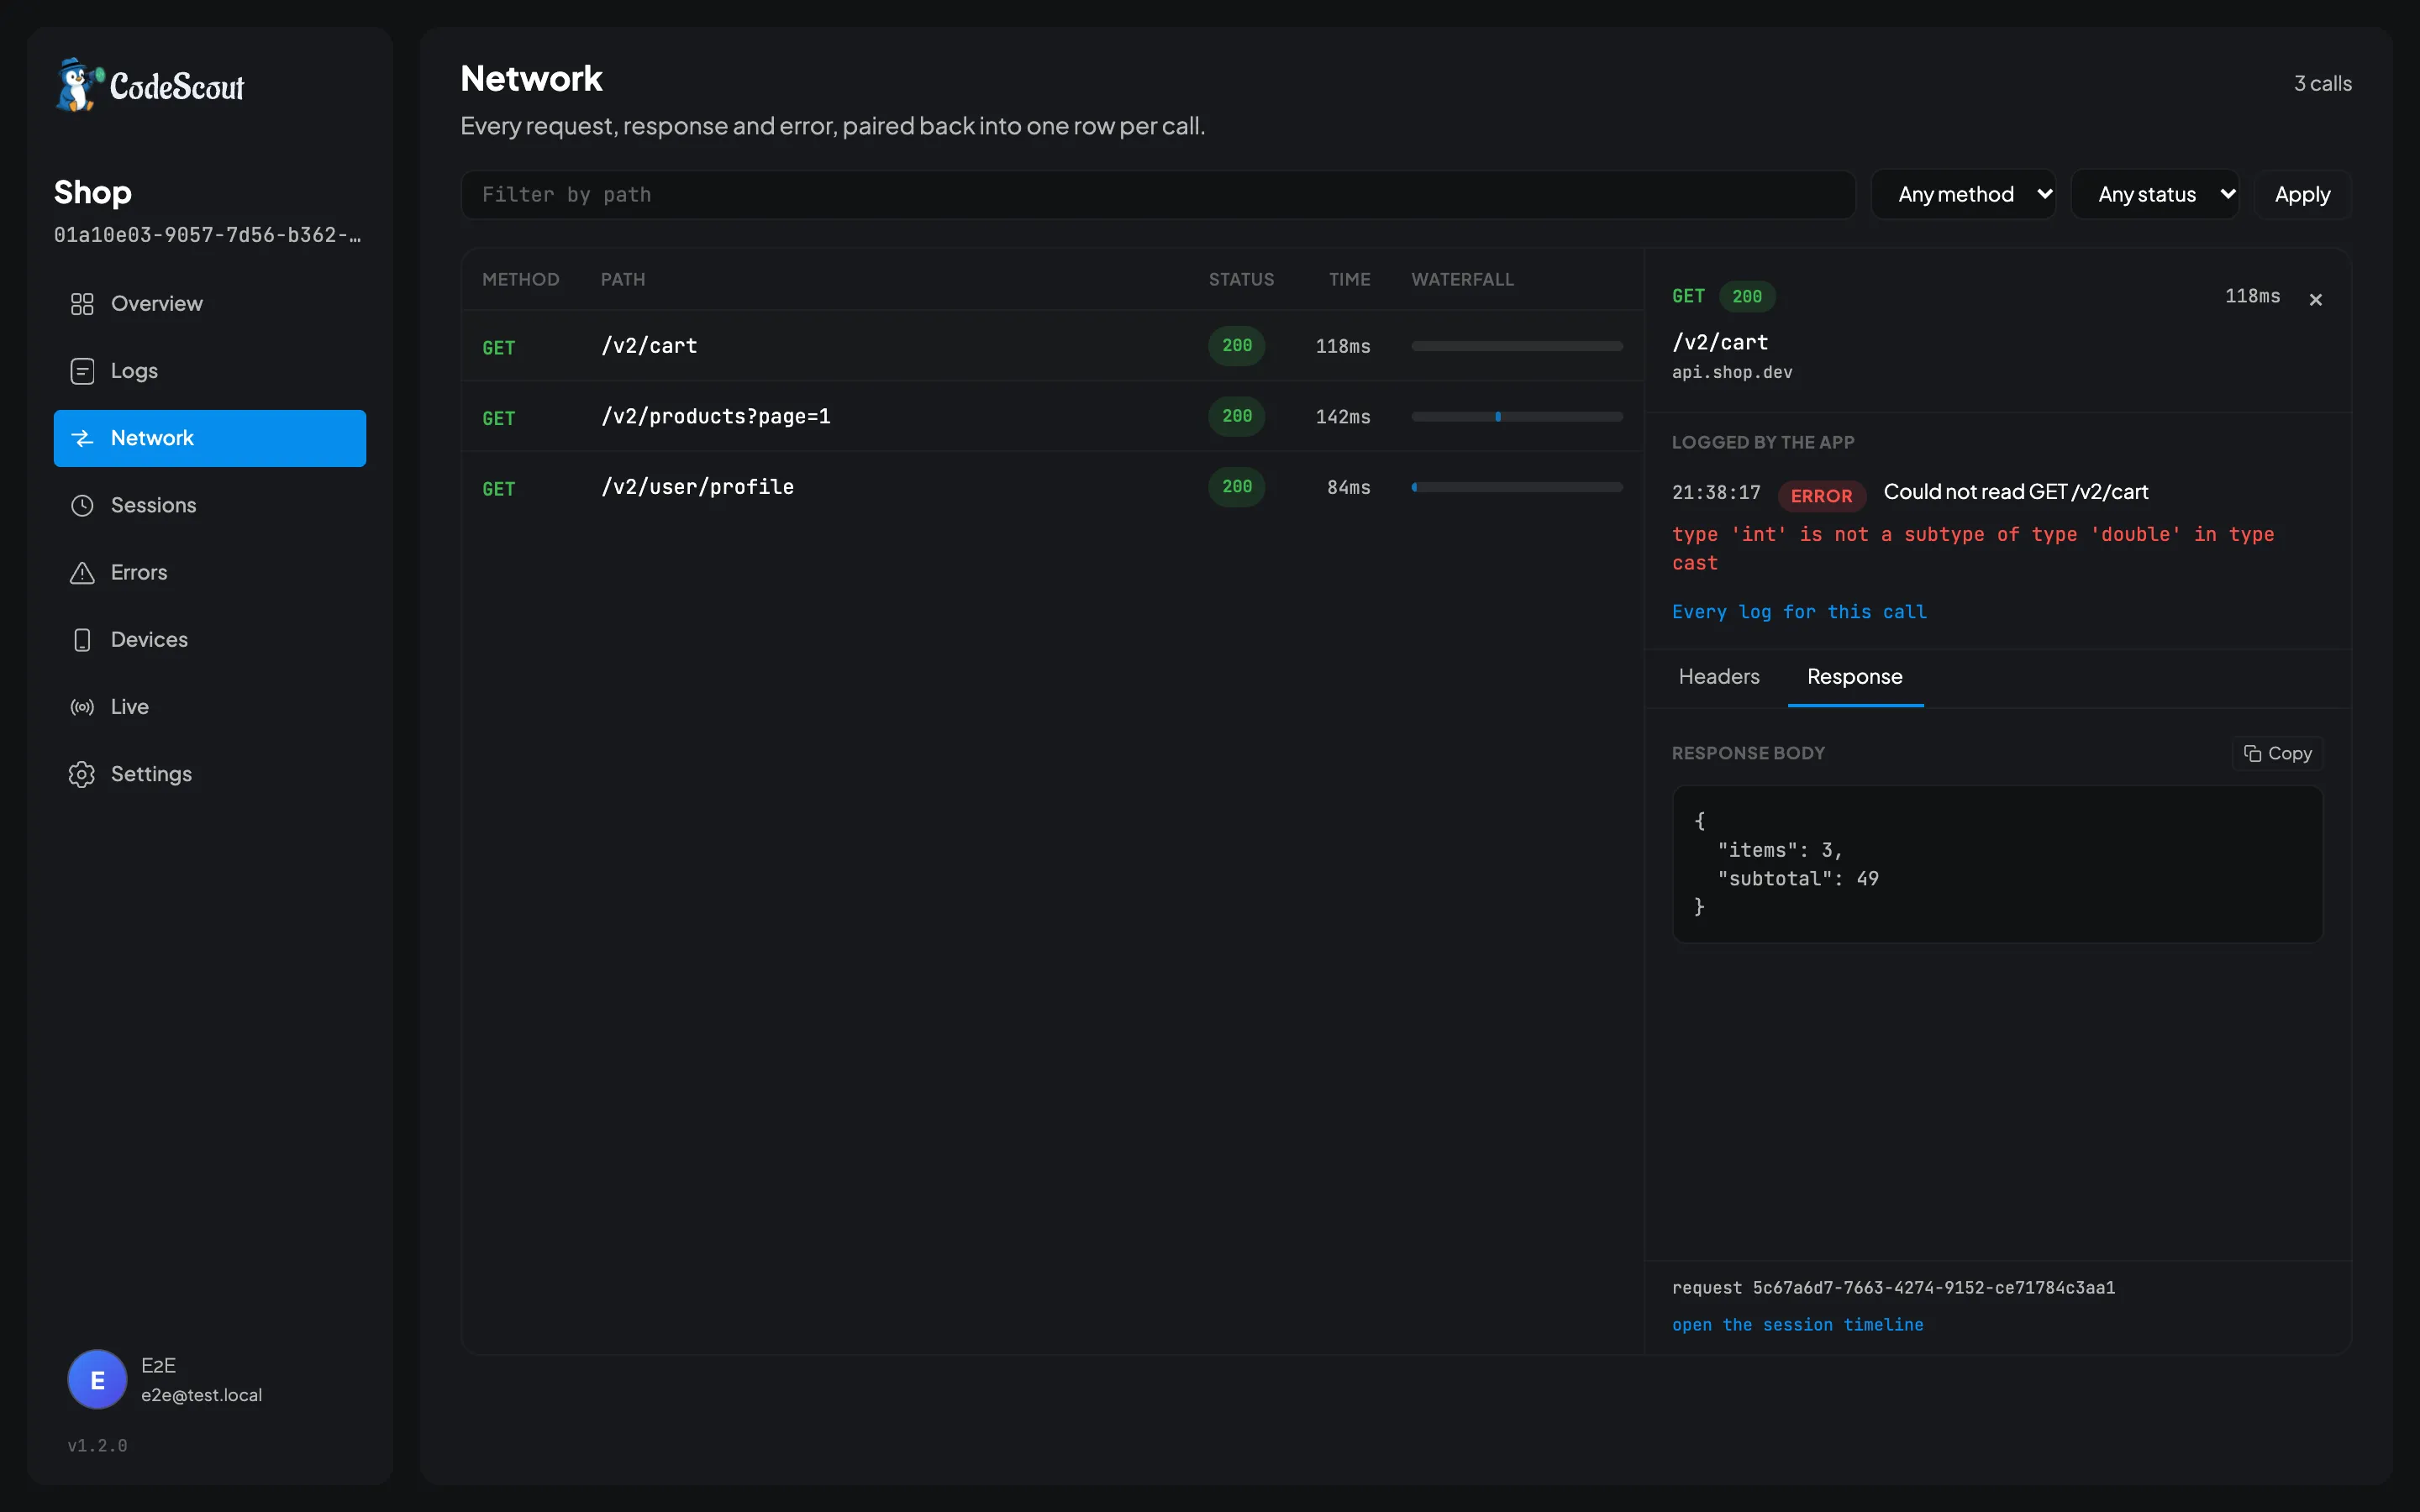
Here the error and the body explain each other: the model wanted a double, and subtotal arrived as
49.
The section lists up to three of your logs for the call. When there are more, its heading says how
many it shows out of the total, such as 3 of 5. The Every log for this call link opens the log
viewer with all of them and the call’s own request and response logs.
The call’s own page has the same section. The Request link on an expanded row in the log viewer opens it, and so does Inspect this call on a session’s Logs tab, which is offered on your app’s log as well as on the network logs.
Numbers are shown as they were stored. A field that arrived as 12.0 reads 12.0, and one
that arrived as 12 reads 12. That difference is often the whole bug, and the network inspector,
the log viewer and the MCP tools that return stored logs all keep it.
Find when it changed
Section titled “Find when it changed”The failing body tells you what arrived. To see what changed, compare it with a call to the same endpoint that your app read without trouble.
On the Network screen, type the path into Filter by path. Every call whose URL contains it is listed, newest first, up to the newest 200, so you can open one from before the failures began and read the two bodies one after the other.
To see whether the change came from the server or from your own release, search the log viewer for the failure one app version at a time:
"Could not read GET /v2/cart" app_version:3.11.2app_version: matches the app version of the launch a log came from, exactly. If every version of
your app starts failing at the same moment, the server changed what it sends. If the failures begin
with one release, look first at the model in that release.
Every log for one call
Section titled “Every log for one call”request: followed by a request id, typed into the log viewer’s search box, lists everything stored
under that id, newest first: the call’s request and response logs, and every log your app linked to
it. It is the search the Every log for this call link runs.
request:5c67a6d7-7663-4274-9152-ce71784c3aa1The id has to be whole. A shortened one is refused rather than matched as a prefix.
With an agent
Section titled “With an agent”If your coding agent is connected over MCP, as Reading CodeScout with an AI agent sets up, hand it the request id and ask it to compare the body with your model. A request that works:
Read request 5c67a6d7-7663-4274-9152-ce71784c3aa1 in the Shop project with get_network_request, then compare the response body with the Cart class in lib/cart/cart.dart. Which field no longer matches, and what did it arrive as?
get_network_request returns the call in two parts. phases is the call itself: the request and
its response or error, with headers and bodies. linked_logs is what your app logged with the
call’s id. The two are kept apart so that an agent does not read your app’s decode failure as the
call’s own error. This is what it returned for the call in the screenshot above, with some fields
left out:
{ "phases": [ { "level": "debug", "message": "Network Request", "call_phase": "request", "method": "GET", "url": "https://api.shop.dev/v2/cart" }, { "level": "debug", "message": "Network Response", "metadata": { "body": { "items": 3, "subtotal": 49 }, "status_code": 200 }, "call_phase": "response", "status_code": 200 } ], "linked_logs": [ { "level": "error", "message": "Could not read GET /v2/cart", "error": "type 'int' is not a subtype of type 'double' in type cast", "request_id": "5c67a6d7-7663-4274-9152-ce71784c3aa1" } ], "linked_logs_total": 1}Numbers come back as they were stored, so the agent sees 12.0 and 12 as different values, as
you do. linked_logs lists the earliest 20 of your logs for the call, each trimmed the way a
search_logs row is, and linked_logs_total counts all of them. search_logs with request: and
the id pages through every one, and get_log returns one whole. When none of the call’s phases
were stored, phases is empty and note says why.
Limits
Section titled “Limits”Bodies over 32 KB are cut. The SDK truncates a body larger than maxBodyBytes, 32 KB by
default, and stores what is left as text, with a note saying how large the whole body was. A field
past the cut is not there to compare. Raise maxBodyBytes while you investigate, or set it to 0
to keep everything. See Bodies.
A redacted value is gone. A key you named in bodyKeys is replaced with [redacted] on the
phone, at any depth, before anything is stored. If the field that changed is one of them, its new
value was never kept. Redaction finds keys by parsing the body, so a body that is not valid JSON
has no keys to match, and nothing in it is redacted.
The error you log is not redacted. It is stored as its text, and a FormatException from
jsonDecode quotes the part of the body where parsing stopped. A value you named in bodyKeys can
be in that part, and it then reaches the panel, the dashboard and a live session. If the body can
hold one, log the message alone, without the quoted part of the body:
error: e is FormatException ? 'FormatException: ${e.message}' : e,Sometimes the call was not captured. The id your log carries may have no request or response stored behind it. The dashboard then shows call not captured, lists your logs, and says: “The request and response for this call were not stored. The SDK writes network logs at debug, so an app whose minimumLevel is info or higher keeps none of them. Retention can also remove them.” The causes, most common first:
- The level. Network logs are written at
debug, and at aminimumLevelofinfoor higher none of them are kept. - Retention. The nightly job removes logs older than the retention window. A call’s network logs are always a little older than your log about the call, so at the edge of the window the call can go first.
- A tag filter. An
enabledTagsset withoutnetworkin it drops every network log. - The wrong id. A UUID that CodeScout did not give the call, such as your backend’s own
X-Request-Id, is kept like any other, but no captured call has it.
A slow call loses its response. The SDK holds a request for two minutes while it waits for the answer. Once that time has passed, the next call the app makes clears it, and a response that arrives after that is dropped. The call keeps its request and shows as pending, with no response body to read.
A body is not always stored as the server wrote it. A Dio body is stored as the JSON object Dio
decoded, written out again by the SDK. The dashboard and the MCP tools list its keys in sorted
order, not in the order the server sent them, and the sort is by byte, so capitals come first. A
code_scout_http body is stored as text and keeps its key order. With no bodyKeys set, that text
is exactly what arrived. Once any bodyKeys are set, recommended() included, a JSON body is
re-encoded before it is stored, as a Dio body always is: the whitespace goes, and a number such as
49.50 or 1e2 is written as 49.5 or 100.0. Either way, what is stored keeps 12 and 12.0
distinct, so read the numbers, and do not read anything into key order or spacing.
On the live screen, a Dio body does not keep 12.0 apart from 12. A Dio body travels as a
decoded object, and the server and your browser both read its numbers as plain numbers, so 12.0
shows as 12. An agent reading the session with tail_live_session gets 12 as well. A
code_scout_http body travels as text and shows as it was captured, 12.0 included. When the
difference matters in a Dio body, read the stored call on the Network screen or in the in-app
panel. Either way, the live Logs tab shows your log as an ordinary row with its
message only, without a link to the call.
- Network inspection: installing an interceptor, and what each call records
- Errors and grouping: how the Errors screen groups messages
- Reading CodeScout with an AI agent: connecting the agent that reads the call for you